


With climate and social issues dominating the front pages of newspapers, the issue of how to integrate sustainability into project and portfolio management is becoming increasingly concrete for organisations. In our previous article we discussed how organisations can translate the term sustainability into concrete indicators. In this follow-up article, we discuss how an organisation chooses their own relevant sustainability indicators and translates them to the different levels. Then we will elaborate a little further on our [sustainability] radar diagram; how do you use it to visualise the impact of the project portfolio on sustainability indicators?
Selecting sustainability factors
Choosing relevant sustainability indicators is a crucial first step to effectively integrate sustainability into project management.
1. Vision and core values of the organisation
It all starts with the organisation's vision. This should give a good indication of its ambitions with regard to sustainability. Think for example of terms such as 'environmental awareness' or 'innovation'. By integrating sustainability into the organisation's vision top-down, it becomes a fundamental part of the organisational culture and strategy.
2. Translation into organisational strategy and concrete objectives
The vision is then translated into a concrete organisational strategy. This means making sustainability ambitions practical by integrating them into strategic objectives and plans. For example, if the organisation aims for CO2 neutrality, this will be translated into a SMART-formulated target.
3. Selecting relevant indicators
Based on the organisational strategy, the organisation selects indicators that reflect the degree of contribution to the objectives. These indicators should be measurable and clearly linked to the specific objectives. For each objective, a key word or measurable term is chosen as an indicator. For example, for the objective of improving energy efficiency by 25%, the indicator 'energy efficiency' can be used.
Example: the vision, objectives and indicators of municipality X
Municipality X strives for a sustainable future where welfare, environment and economy are in balance. Our vision is further elaborated in an organisational strategy with corresponding objectives.
1. Energy transition:
- We encourage solar and wind energy, constructing energy-efficient buildings and supporting initiatives for natural gas-free homes.
- We are investing in smart grids and energy storage to maximise the efficiency of renewables.
To make this strategy measurable, Municipality X sets a target: Municipality X aims to be fully carbon neutral by 31 Dec 2030, produce 50% less waste compared to 31 Dec 2025 and get 100% of its energy from renewable sources.
- CO² reduction (indicator)
- Waste production (indicator)
- Energy from renewable sources (indicator)
2. Sustainable mobility:
- Municipality X encourages the use of public transport, bicycles and electric vehicles by building bicycle paths, electric car charging points and an efficient public transport network.
- We organise campaigns to make residents aware of the benefits of sustainable mobility.
With this strategy, the following objective has been established: Municipality X aims to increase the use of bicycles for commuting by 40% compared to January 2025, through the construction of new cycle paths and secure bicycle parking facilities. 75% of public transport by 2030 will be emission-free through the use of electric buses and trams.
- Use bicycle as means of transport (indicator)
- Public transport emissions (indicator)
3. Cooperation and participation:
- Municipality X works closely with residents, businesses and civil society organisations to promote sustainability. We organise regular meetings and workshops to share ideas and initiatives.
- We offer educational programmes and grants to support sustainable projects and encourage active community involvement.
This strategy is made measurable by the following objective: Municipality X wants 40% of residents to be actively involved in at least one sustainability project, through education and participation programmes.
- Involving residents (sustainability projects) (indicator)
By following these steps, an organisation ensures that sustainability indicators are not only relevant, but also practically applicable within the organisation. This helps to integrate sustainability into project and portfolio management in a structured and measurable way.
Use radar chart within the portfolio
If sustainability goals are clear within the organisation, they can also be included as a decision variable in portfolio management. After all, the projects in the project portfolio must contribute to the goals set by an organisation.
The first step to include sustainability objectives in portfolio management is to score the impact of the various projects using the indicators. Projects can be ranked according to the (indicator) score used to see how much a project contributes to the objectives.
We take the example of municipality X. The objective is to be completely Co2 neutral by 2030. This means that the Co2 emissions indicator can be used to score the various projects. If a project contributes nothing to the reduction of Co2 emissions, it gets a score of 0. If the project has a huge impact on Co2 emissions, it gets a score of 10. Suppose the municipality sets the target for total Co2 reduction/compensation equal to 20, then a project that can achieve this for 10% gets a score of 2 (10% of 20).
Based on the organisational objectives, scoring these projects on sustainability indicators can help select the projects within the portfolio. Are there minimum requirements that the project portfolio must meet? Then make sure to select projects that can meet the requirements via this score.
By aggregating the scores of various projects, the impact of various project combinations on the sustainability objectives can be visualised. We show this using an example.
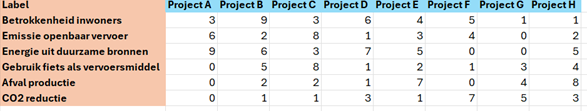
Municipality X has 8 possible projects to contribute to its sustainability goals. The projects are given a score of 1-10.
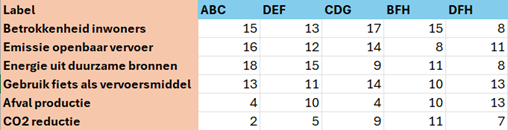
A number of scenarios of project combinations are then outlined. The projects can be ranked according to the scores, after which various combinations can be made and the scores added together. For example, five combinations of projects are suggested.
The combinations of projects are visualised in one or two radar diagrams.
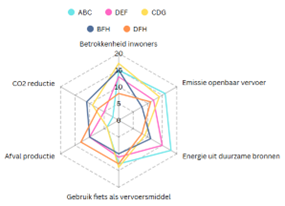
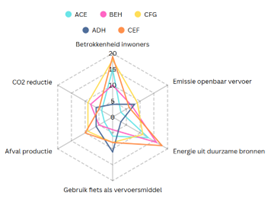
The radar diagram is a useful tool to visualise how the choice of various projects helps contribute to an organisation's sustainability goals. As the example above shows, it is possible to visualise the combination of a number of projects within the portfolio in the radar diagram. This shows nicely that some combinations from the right diagram have a less balanced impact than in the left diagram. So, depending on the needs of the organisation, a balanced project portfolio can be chosen, or, for example, a sub-portfolio that focuses on a particular indicator. Using the radar diagram, it is possible to visualise that all indicators of the objectives are affected by the three chosen projects. If it turns out that certain indicators are not affected enough, it can be chosen to add projects or make another selection.
There are several handy tools to draw up these radar charts. It can be done in Excel, but also, for example, in Canva. The advantage of Canva is that it is easy to change the formatting and click on certain combinations of projects to highlight them. This makes it a handy tool for creating clear graphics that can support a story relatively easily.
So, the radar diagram is a useful tool to visualise the impact of projects on various sustainability indicators. But, this only works if these sustainability ambitions are woven into the various layers of the organisation. Make sure the vision and strategy are clear before they are translated into objectives and measurable indicators. Once these have been drawn up, the organisation can get to work and visualise them using the radar diagram.
Sustainability is an integral part of IMPROVEN's portfolio, with the radar diagram (sustainability) as a valuable tool in the IMPROVEN Toolbox. We support organisations in translating sustainable ambitions into executable strategies and concrete actions within sustainability projects, programmes and portfolios.
Feel free to contact Emy van Oers (Emy.van.Oers@improven.nl) and Elbert Jochemsen (Elbert.Jochemsen@improven.nl) for more information!