


Successful organisations continuously measure how their processes contribute to the organisational strategy and customer promise. This applies not only to large organisations, but also to smaller businesses such as a pizzeria. A successful pizzeria is not just about good ingredients and a fast oven. Every action in the process - from buying tomatoes to delivering a pizza - must contribute to customer satisfaction and the organisation's strategic goals. But how do you measure that?
In this blog, I show you how to translate from strategy to measurable process indicators and how to gain insight into performance via a daily or weekly start board.
I chose to use a pizzeria as an example because I recently went out to eat at a pizzeria for my birthday with my family.

Willem-Jan Vos
Senior Consultant
From strategy to measurable process performance
To ensure that processes contribute to the strategy and customer promise, strategic goals should be translated into measurable process indicators. This helps not only in monitoring performance, but also in targeted process improvement. This translation process involves four steps, using a combination of top-down and bottom-up approaches. The table below shows what this process looks like using a pizzeria as an example.
| Step | Approach | Example pizzeria |
|---|---|---|
| 1. Develop mission, vision and strategy | Top down approach | Mission: "To deliver the tastiest, freshest pizzas with fast service and a smile."
Vision: "We want to be the region's favourite pizzeria, known for quality and customer focus." Strategy: Use of fresh ingredients, fast delivery, and optimal customer experience. |
| 2. Naming critical success factors. | Top down approach | Freshness of ingredients and consistent taste (product quality)
Short waiting times and fast delivery (process efficiency) Motivation, commitment and job satisfaction (employee satisfaction) |
| 3. Develop connecting critical performance indicators in processes | Bottom up approach | % fresh ingredients, % taste/quality complaints, % repeat visits (product quality)
Average preparation time (minutes), % deliveries within 30 minutes (process efficiency) Employee satisfaction score, % absenteeism, turnover rate (employee satisfaction) |
| 4. Linking critical success factors and critical performance indicators | Bottom up approach | This is further detailed in this blog, which identifies how each process step contributes to the strategy and customer promise. |
Linking critical success factors and critical performance indicators with processes
To understand how each process step contributes to the strategy and customer promise, the pizzeria's core processes are mapped. For each step, the associated activities, critical performance indicators (KPIs) and their contribution to the overall objectives are named.
In addition, some KPIs, especially those related to employees (such as employee satisfaction and absenteeism), are not exclusively linked to one specific process step, but affect the entire pizzeria. These play a role especially in the process steps 'Preparing kitchen', 'Preparing pizza' and 'Handling customer feedback', as efficiency, team motivation and customer interaction are strongly related to final performance here. Therefore, these KPIs are also included in the table below.
| Process step | Activity | KPIs | Contribution to strategy & customer promise |
|---|---|---|---|
| 1. Buying ingredients | Ordering fresh ingredients | % fresh ingredients, delivery reliability (%) | Fresh ingredients ensure consistent product quality |
| 2. Preparing kitchen | Cutting ingredients and preparing dough | Waste (%), stock accuracy (%)
Employee satisfaction score, % absenteeism |
Efficient preparation prevents delays in preparation
Less downtime = stable team and more efficient process. |
| 3. Record order | Taking customer orders (in restaurant, by phone or online) | Average order time (seconds), % correct orders | Quick and error-free recording increases customer satisfaction |
| 4. Preparing pizza | Composing and baking pizzas | Average cooking time (min), % correct preparations
Employee satisfaction score, % absenteeism |
Fast and high-quality preparation contributes to customer experience
Satisfied employees deliver better quality, fewer errors. |
| 5. Collection or delivery? | Decision whether customer picks up or delivers | % takeaway versus % delivery | Pick-up/delivery ratio (for analysis, not as a performance KPI) |
| 6. Serving in restaurant | Serving pizza at the table | Time between preparation and serving (min) | Fast and hot pizza improves customer experience |
| 7. Delivery to customer | Pizza packaging and delivery | % deliveries within 30 minutes, average delivery time (min) | Fast delivery ensures hot pizza and satisfied customers |
| 8. Processing aftercare and feedback | Asking for feedback and handling complaints | % followed-up complaints within X days, number of reviews received per month, average rating from reviews (1-5 stars) | Improvement based on customer feedback increases loyalty
Well-served customers = higher customer satisfaction and job satisfaction. |
Measuring and improving: the performance board
An effective way to continuously monitor performance is to use a daily or weekly start board. This board provides an overview of key performance indicators and allows improvement actions to be discussed directly. It focuses on three key components: product, process and people. For each component, relevant indicators are tracked, so that trends become visible and targeted improvements can be made. The table below provides an overview of these components and the corresponding targets.
| Section | Explanation part | Indicator | Objective |
|---|---|---|---|
| Product | Focuses on the quality and customer appreciation of the final product. The aim is to ensure that the product meets customer expectations and quality standards. | % complaints about taste, % repeat visits | 70% |
| Process | Refers to the way work is carried out within the organisation. This includes the methods, procedures and steps taken to create products or services. The aim is to optimise the efficiency, quality and turnaround time of processes. | % deliveries within 30 minutes, % stock accuracy | > 90%, > 95% |
| Man | Refers to the people within the organisation. This component focuses on employee engagement, safety, productivity and development. It includes monitoring and improving staff performance and well-being. | Number of sick calls, Employee feedback score (daily check-in) | 7/10 |
For continuous improvement, it is not enough just to look at individual results; it is at least as important to analyse trends and developments over a longer period. By monitoring key KPIs on a weekly basis, recurring patterns can be recognised and targeted improvement actions determined. Evaluating both short-term and long-term performance provides insight into structural trends, which helps to make sustainable improvements. The graph below shows the weekly percentage of complaints about taste. This example shows a decreasing trend, indicating that improvement actions are having an effect.
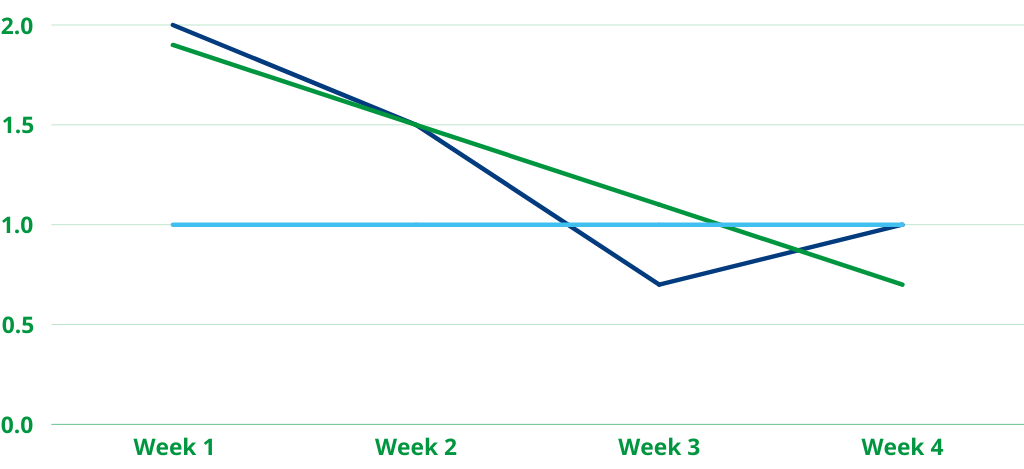
Figure 1: Sample performance board % complaints about taste
A measurable strategy as the key to success
When strategy, critical success factors and performance indicators are clearly linked, everyone in the organisation understands how their contribution supports the end goal. A pizzeria that applies this well excels in quality, speed and customer experience - and becomes the favourite in the region.
Do you also want a better understanding of how your processes contribute to strategy and customer expectations? Take the first step with these four steps and make performance measurable and open for discussion!
Want to know more about this article?
Feel free to contact Willem-Jan. He will be happy to tell you more!