CONTROL CHART
![]() Description
Description
The Control Chart is a graph that shows trends, shifts or patterns in the output of a process over time. In other words, the control chart basically shows the performance of the process in a time sequence.
Every process is subject to variation. Compare it to biscuits that vary in weight or size. Within some processes, there is normal variation in which variation is natural to the process. This is variation that is always present and difficult to detect. In the example of biscuits, it appears that there is variation in weight: Most biscuits weigh between 2.5 and 3.5 grams. This variation is acceptable.
Besides normal variation, there is also special variation ('special cause'). This is variation that occurs occasionally and can disrupt the process. This is due to the influence of an identifiable cause. For example, when two biscuits weigh too much, special variation is suspected. Something in the process has caused these biscuits to be too heavy.
![]() When
When
In the phases Analysing problem and Securing results.
![]() Goals
Goals
The rule map shows whether the process is mastered, whether trends in performance can be identified, and it enables the identification of quality problems in the process.
![]() Steps
Steps
- Collect reliable and representative data on the process.
- Put the dates in chronological order.
- Use Minitab or Excel to create the control chart.
How to interpret the rule map?
The following is an example of a control chart of the processing times of a process.
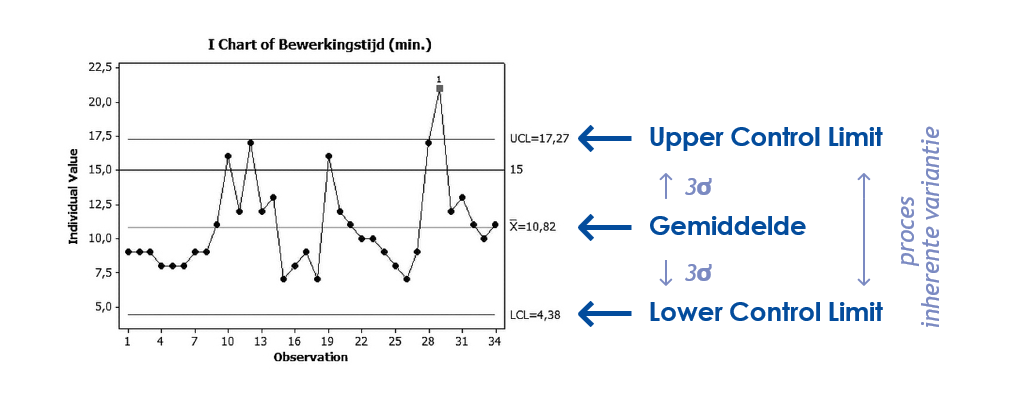
Essential to a control chart are the Average ('centre line') and the two con- trol limits: the Upper Control Limit (UCL) and Lower Control Limit (LCL). These are the limits that indicate how much the process is allowed to deviate from the average.
Figure UCL and LCL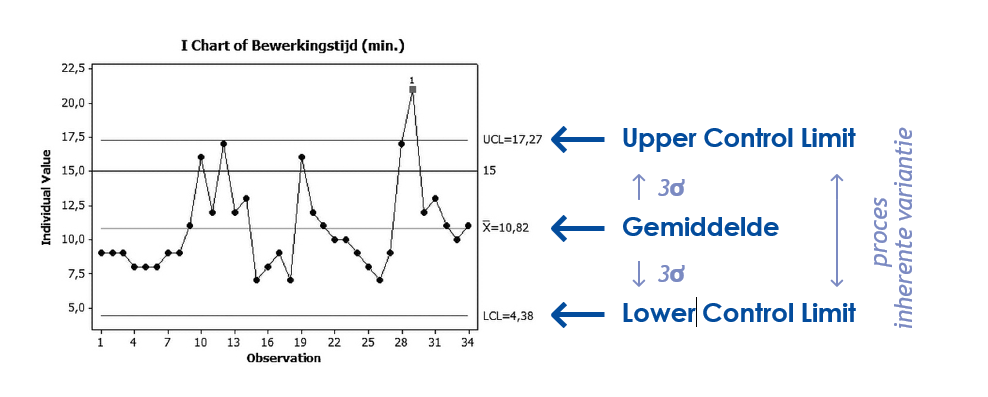 Another important element of the control chart is signals/outliers: the process is performing outside the control limits. This means that the process is not statistically controlled. The cause of an outlier should always be investigated.
Figure Signal
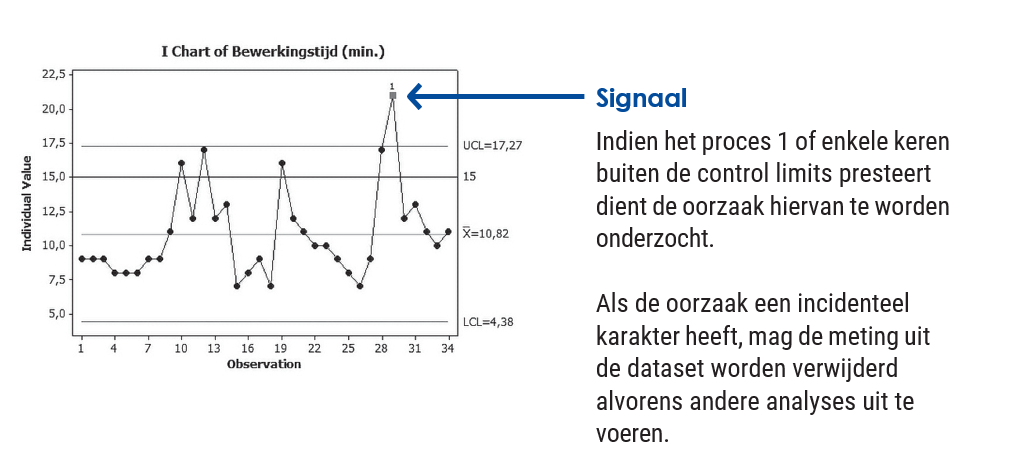
Trends can also be detected with a control chart.
Figure Trend
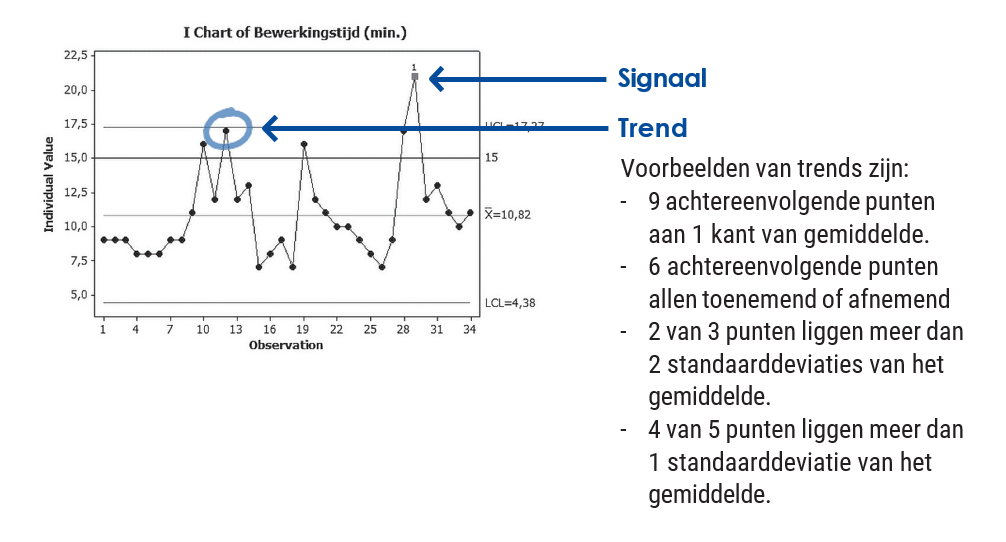 Using the rule map, the following questions can be answered:
- Is the process controlled? You can determine this from the Control Limits and signals.
- Are there any standouts (outliers and/or trends) in performance?
- Is there a problem with this process, if so what kind of problem? There are four types of quality problems:
Figure Quality problems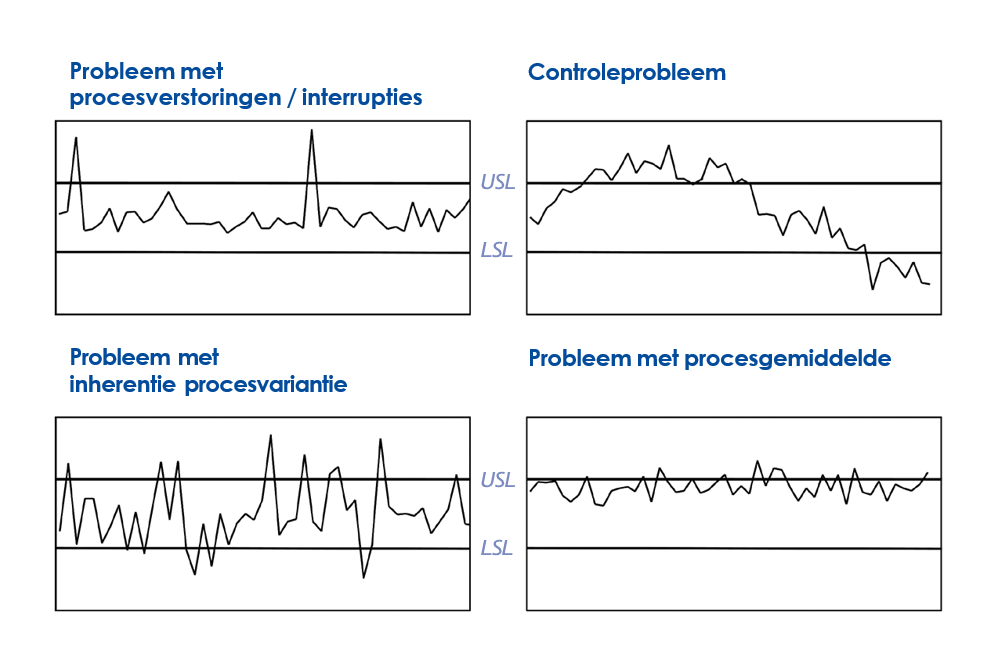
![]() Examples
Examples
In the following example, we apply the rule map shown earlier in figures 55 to 54. We see:
- average processing time 10.82 minutes;
- UCL 17.27 minutes;
- LCL 4.48 minutes.
 To assess process performance, we ask the following questions:
- Is the process controlled? Answer: no, there is an outlier. This should be investigated.
- Are there any standouts/trends? Answer: yes, we see a trend. In the programme Minitab, all trends are numbered and you can thus find out which trend it is.
- Is there a problem with this process? Answer: we cannot tell that from the rule card above. To determine this, you need the customer requirement (USL/LSL). After all, only if you know what the customer wants can you determine whether there is really a problem.
Suppose the customer request (USL) in this case is 15 minutes (the operation should take a maximum of 15 minutes). We can represent that in the same rule map and it will look like this:
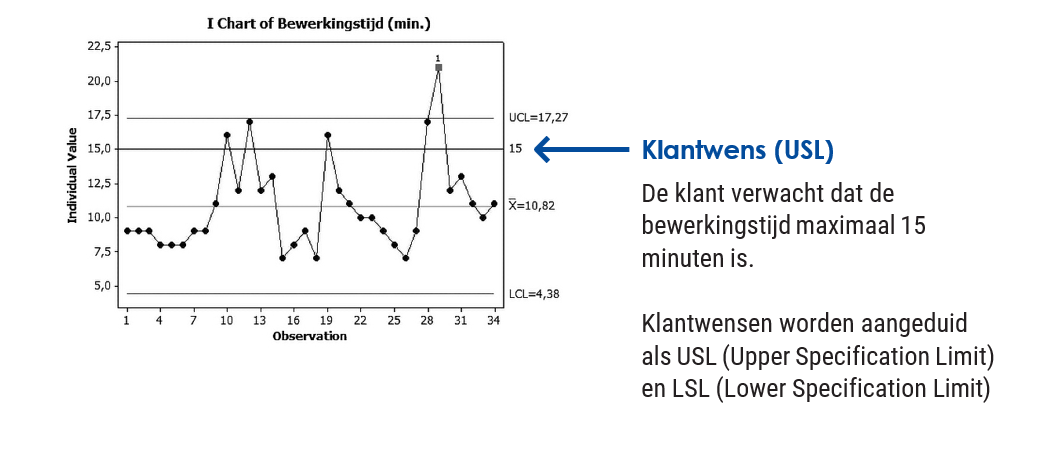
Example Customer requirement
In this example, the customer desire is met in most cases. Most observations are under 15 minutes. There is an outlier problem in this case. There also seems to be a lot of variation in the processing times (variation problem), although this is of less interest to the customer (after all, in most cases the customer's wish is met).
![]() Tips:
Tips:
- Always use a chronological order in the dataset.
- Do not include too many data points in the control chart.
- Realise carefully which time period the rule card refers to.
- Follow-up research is always needed. A control chart graphically shows the process performance, but does not provide insight into the possible causes and (numerical) extent of the problems.


