DISTRIBUTION OF THE DATA
![]() Description
Description
The distribution of the data is tested by testing the distribution from the measurement against distributions as they would ideally run. The better the fit to the distribution, the greater the match to the distribution and the more likely you can assume that the distribution follows the predictable pattern.
Question: does process performance have a (normal) distribution?
- The Normal Probability Plot provides insight into whether the process is normally distributed.
- If the process performance is not normally distributed, it can be tested whether the data fit another distribution by performing an Individual Distribution Identification test.
- The outcome of Probability Plots are represented in a number: the P-value.
![]() When
When
In the phases Analyse problem.
![]() Goals
Goals
It is used to test whether the data are predictable. If a process does not have a recognised distribution, the conclusion is that the outcomes from the measurement are less reliable. It cannot then be said with certainty that a next measurement will have the same, similar outcomes. This is not an immediate bar to the measurement, but does indicate to the process supervisor that he should not present the measurement results as infallible fact.
![]() Steps
Steps
- Collect reliable and representative data on the process.
- Use Minitab or Excel to create a Probability Plot and/or Individual Distibution Identification.
![]() Examples
Examples
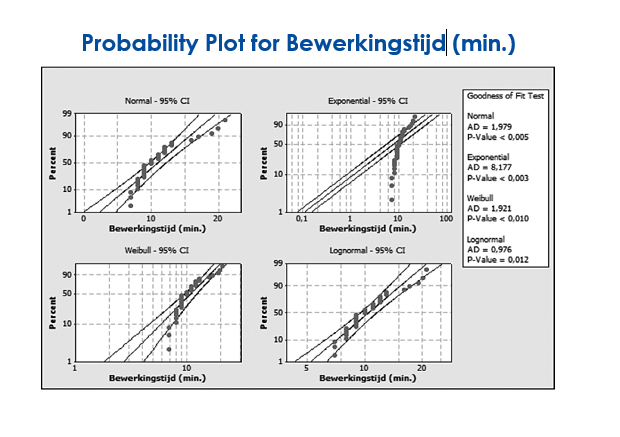
Here is an example of a control chart of the processing times of a process. The Individual Distribution Identification gives in several charts the outputs of the Normal, Exponential, Weibull and Lognormal tests. Incidentally, a test is possible to generate 14 different distributions, but these are the most common.

Figure: Probability Plot
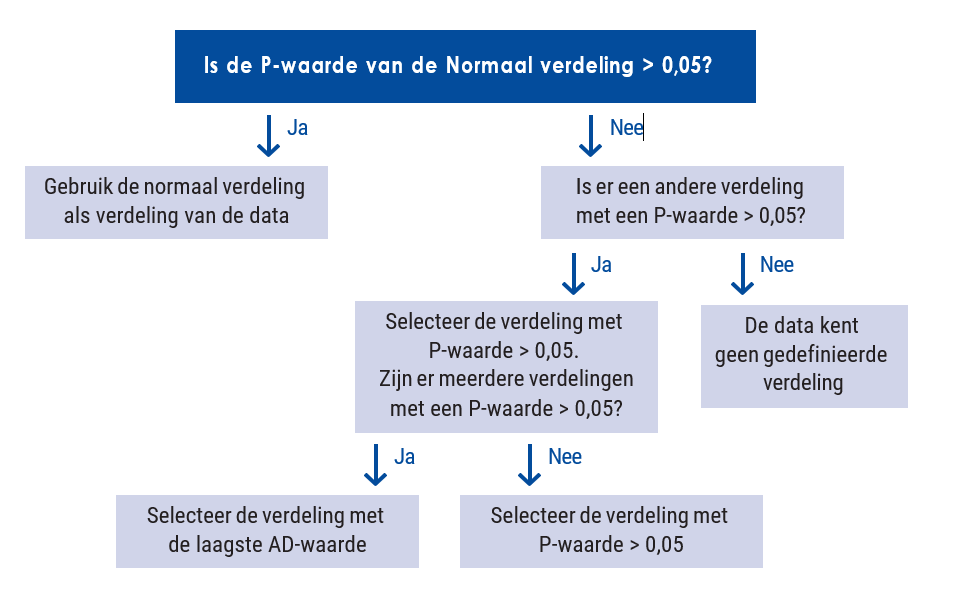
To decide which distribution applies, we use the following decision tree:

Figure: Decision tree
If a defined distribution of data is not observed, there could be several reasons:
- Incidents in the process causing data to show outliers.
- The dates concern two (or more)
- Different processes;
- Various products;
- Different complexity of implementation.
If a complexity of execution is identified, it may be advisable to analyse the different processes separately.
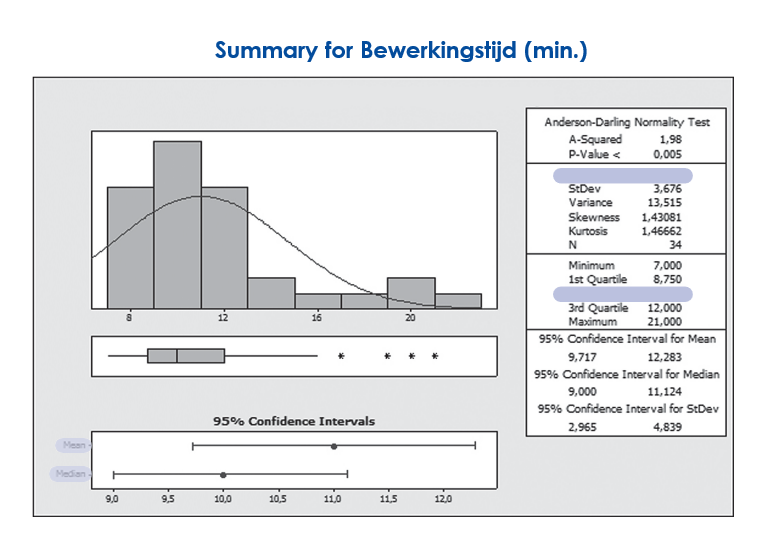
If there is no defined distribution, mean and standard deviation say nothing about the process. We then use alternative values such as median and quartiles. We then work, for example, with a boxplot to show the distribution of the process.

Figure: Summary processing time
![]() Tips:
Tips:
- Don't expect normally distributed data. Most processes (in service organisations) do not have such a predictable pattern.
- If there is no defined distribution, it is often because there are several influence factors that make the process run differently. However, it is not always possible to find out these influence factors because there are many small factors that, in combination, influence the process.


